How We Use Sugar’s Dashboards
As a Product Manager, I’ve created a number of dashboards for my own use to provide an overview of our:
- Sales pipeline process
- Marketing efforts
- Customer Support interactions
- Contract renewal processes
My personal preference is to have multiple dashboards. I use an overview dashboard combined with several more focused departmental dashboards.
When customizing your dashboard, the two most versatile dashlet components are the List View dashlet and the Saved Reports Chart dashlet. Using the List View you can easily create a list of your most recent hot leads or your highest priority service tickets. Using the Saved Reports Chart dashlet you can use the chart from any standard or custom report in the system to create a visual representation of your data.
I will review three dashboards from my collection.
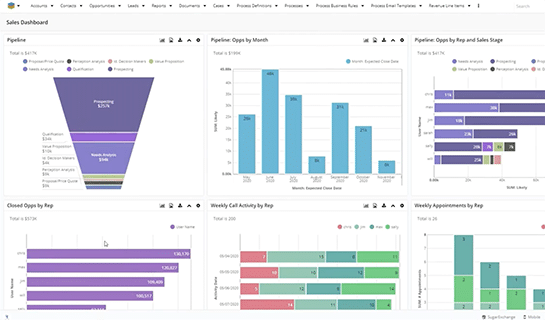
Sales Dashboard
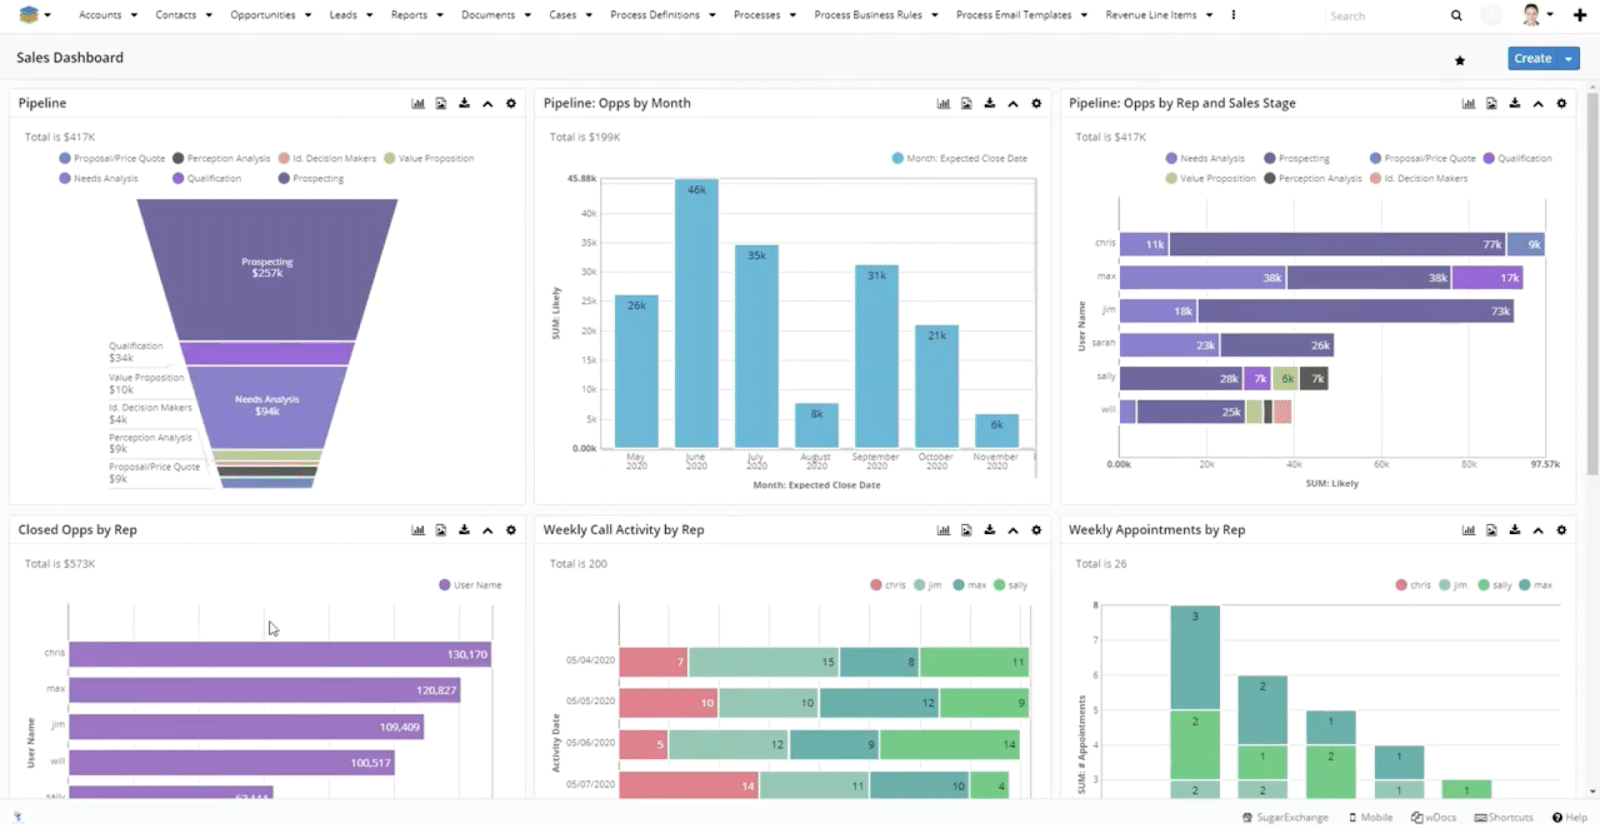
Here I see a selection of key information managed in Sugar. From right to left, here is a description of each dashlet:
- Current Quarter Sales pipeline
I use this to remind myself to keep my pipeline up to date and make sure I drive opportunities forward.
- Opportunities by Month
I like this dashlet because it helps me quickly compare the value of our monthly won opportunities and it also offers a projected value for the current month.
- Opportunities By Reps and Sales Stage
I use this to monitor the volume of monthly qualified opportunities entering our sales process, broken down by each sales rep in our team and the sales stage the opportunity finds itself in.
- Closed Opportunities by Rep
With the help of this dashlet, we keep a closer eye on each sales rep’s performance. This, of course, drives healthy competition within our team, too.
- Weekly Call Activity By Rep
This dashlet helps us account for the time spent in calls by each sales rep, weekly.
- Weekly Appointments by Rep
Not only calls with sales-ready opportunities can drive sales, but also face-to-face appointments. I like to keep a closer eye on each rep’s weekly appointments, for comparison.
Pipeline Metrics Dashboard
Here is a sample of my Pipeline Metrics dashboard from our own Sugar system.
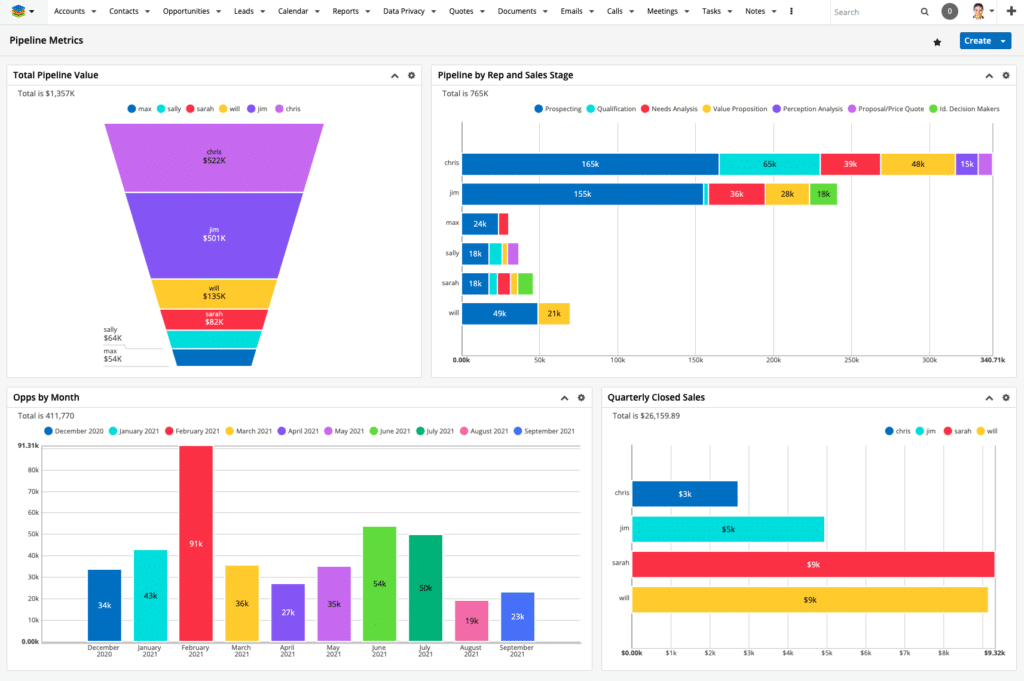
- Total Pipeline Value
Here we display a traditional funnel chart for the total of our open opportunities, segmented by sales rep and the likely sales amount for each rep. We customize our sales pipeline to reflect our sales performance as team members.
- Pipeline by Rep by Stage
This horizontal bar grouped chart lets us get a better visual representation of our pipeline, broken down by sales stage and the assigned sales rep.
- Opportunities by Month
This dashlet offers me and my team a projection of our opportunities, their expected close date, and value. With the help of this dashboard, we can make informed calls and adapt our approach to push opportunities down the funnel.
- Quarterly Closed Sales
Again, broken down by user, we have the Quarterly Closed Sales dashlet that gives us an accurate depiction of won opportunities, as well as their value.
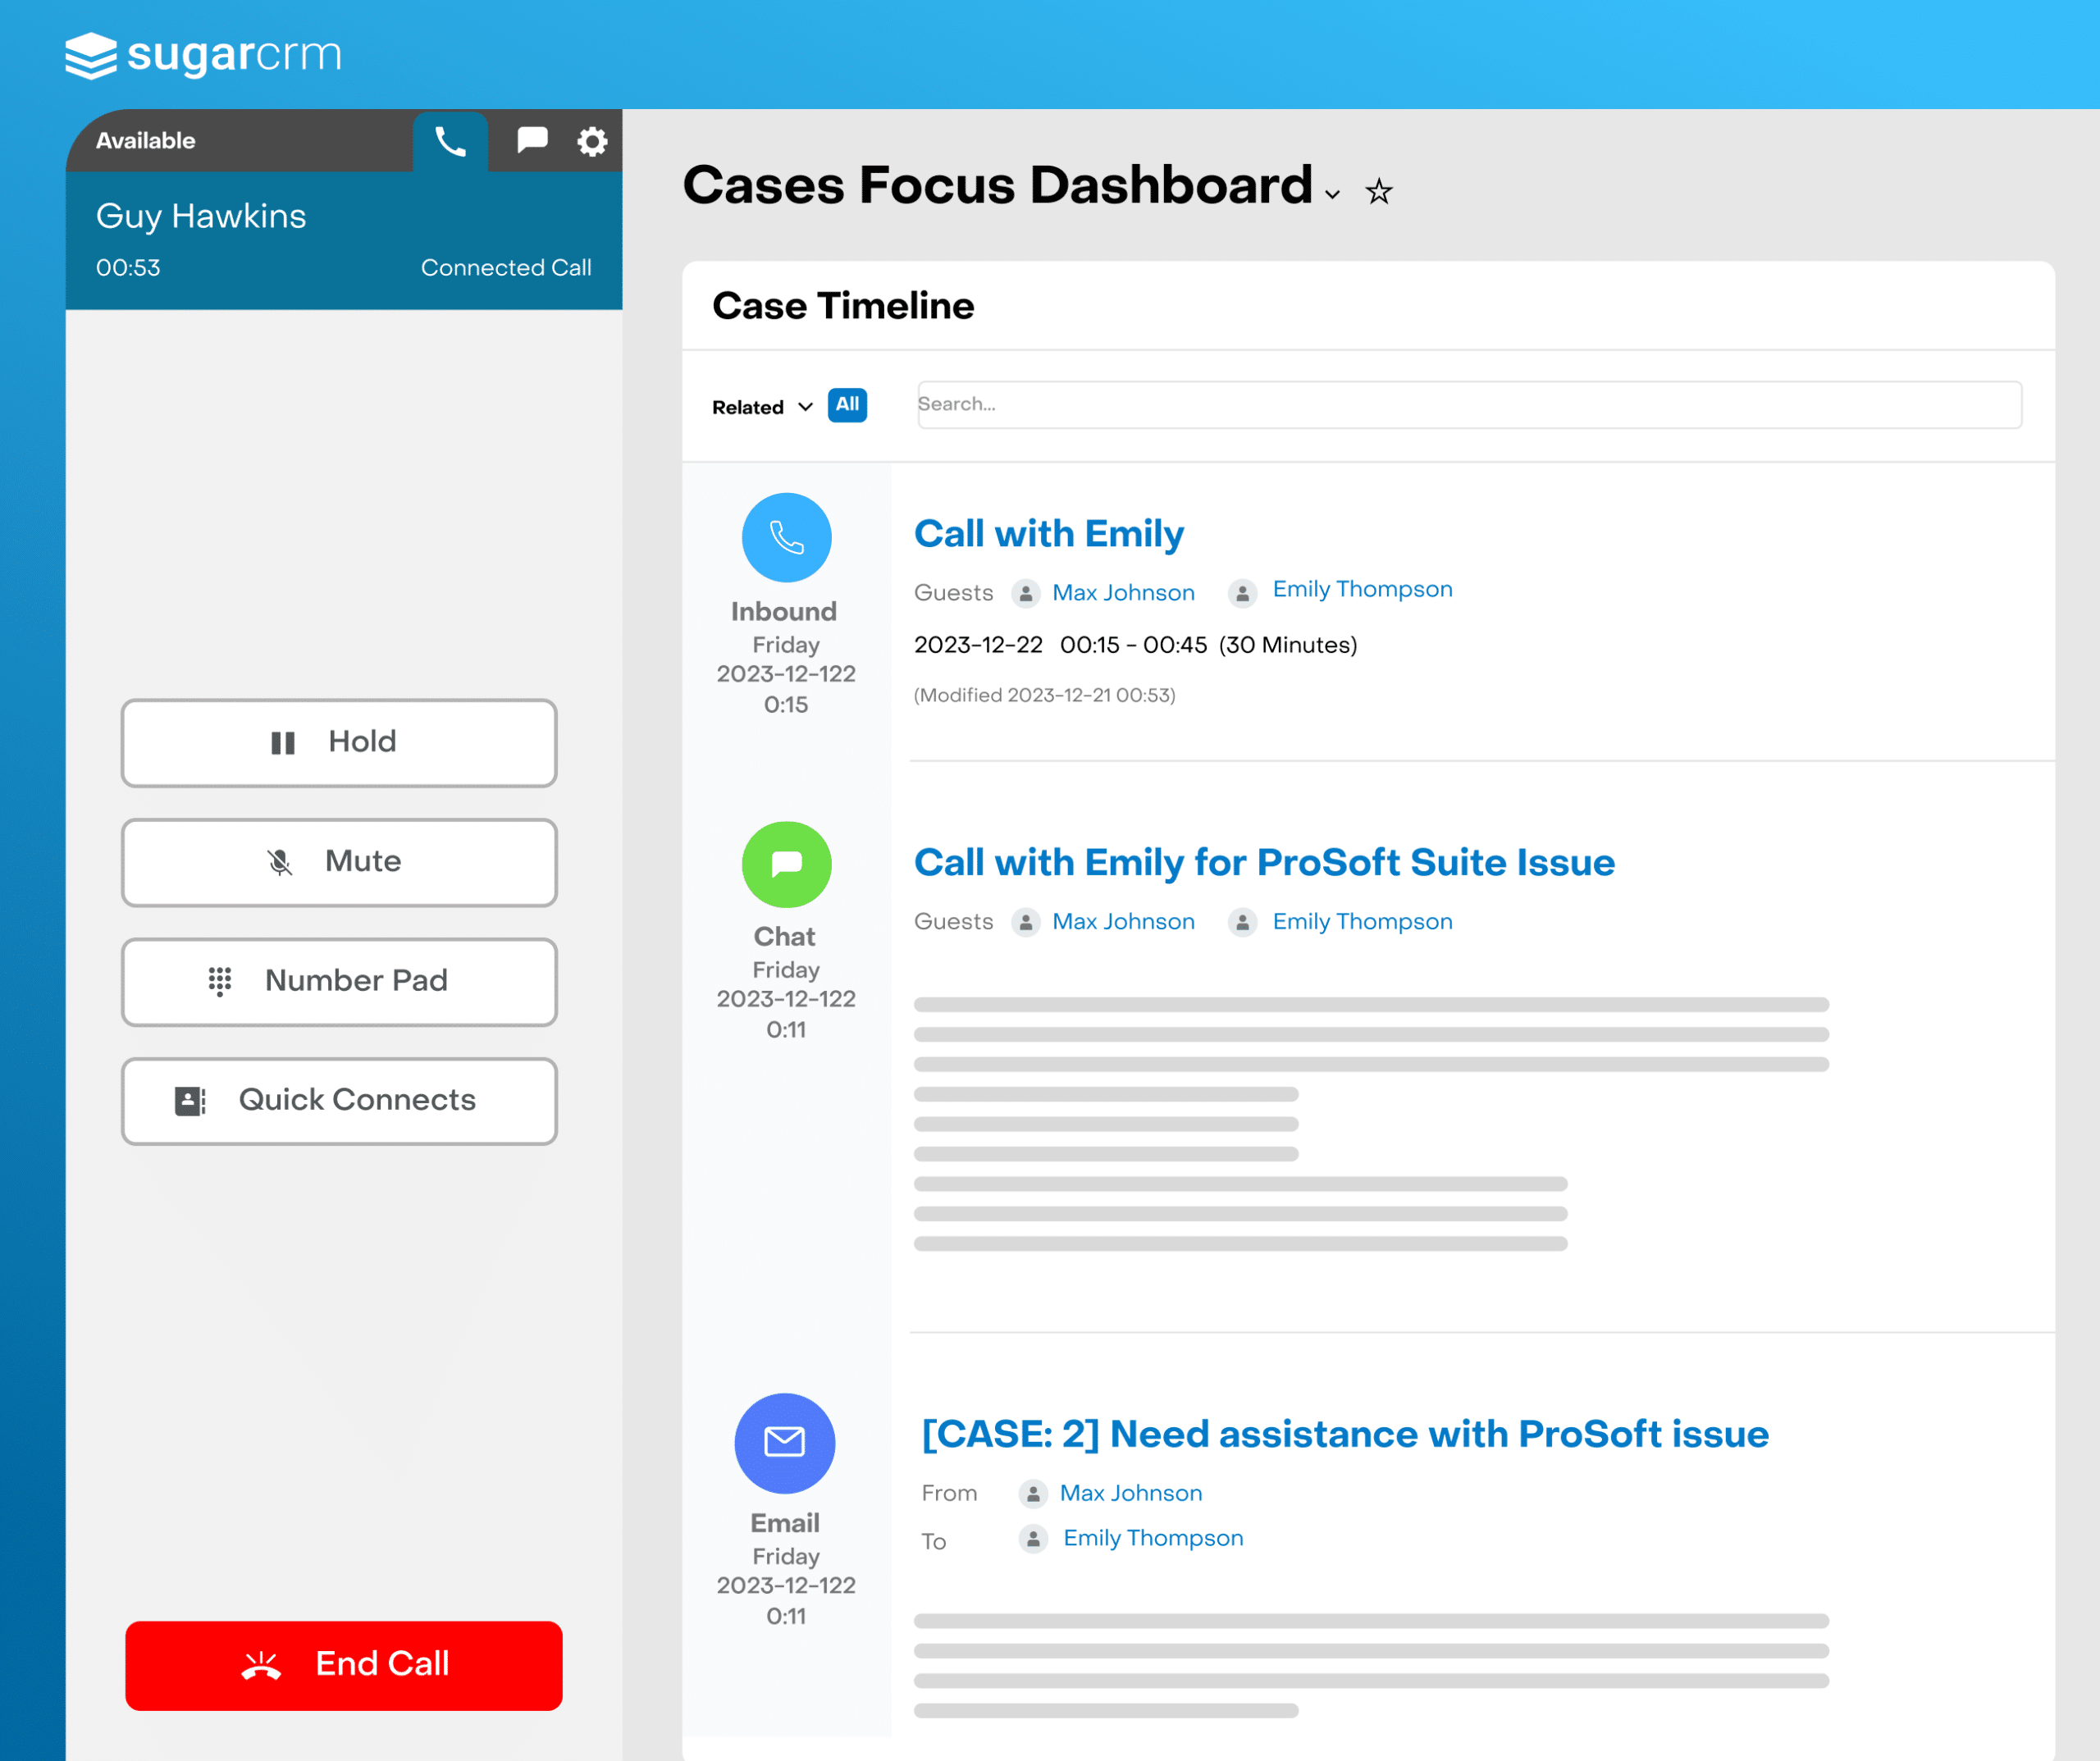
Customer Support Dashboard
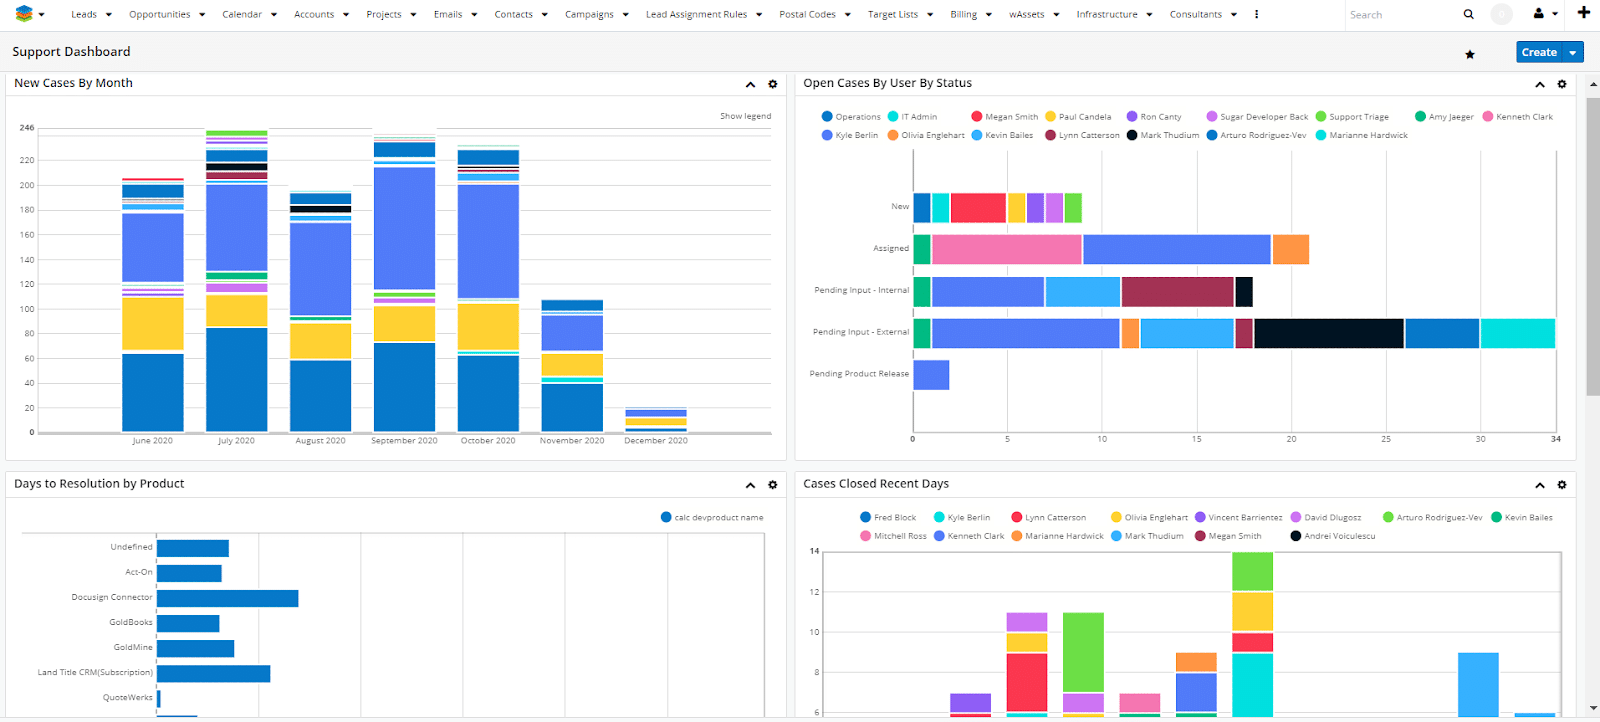
The support dashboard gives more detailed visibility into the Support activity.
- New Cases by Month
This is a repeat from the main dashboard showing the volume of new cases created per month.
- Open Cases by User by Status
This chart shows the number of open cases by the assigned user and grouped by the case status (New, Working, Waiting for Customer input, etc).
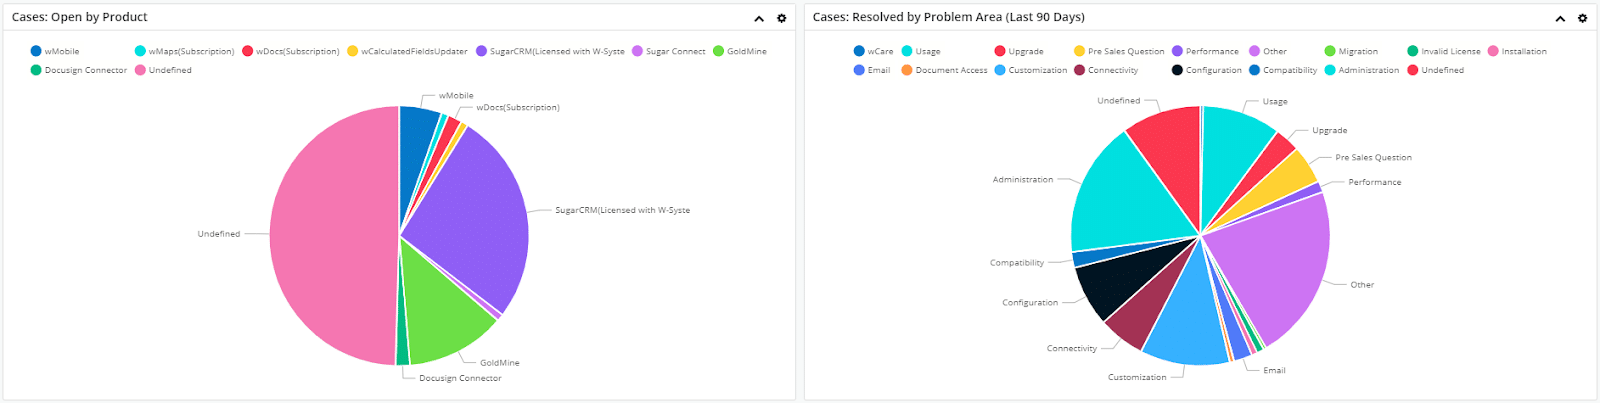
- Cases by Product
This pie chart shows the distribution of open cases by the type of product they are related to.
- Cases Closed
This chart shows the number of cases closed by the support desk day by day for the last 30 days.
- Open Cases by Priority
This chart shows all open cases by user and grouped by priority. This is mostly used to spot if a user is handling high priority cases.
- Cases by Problem Area
This pie chart shows the distribution of support cases received in the last 90 days by problem area.
To learn more about how to manage your dashboards you should review the SugarCRM Home page documentation.
If you would like help organizing your own dashboard metrics we stand at your service. Contact us for a consultation.